Note: You can find the charts & graphs for the Big Story at the end of the following section.
Inventory, sales, and new listings rose in August
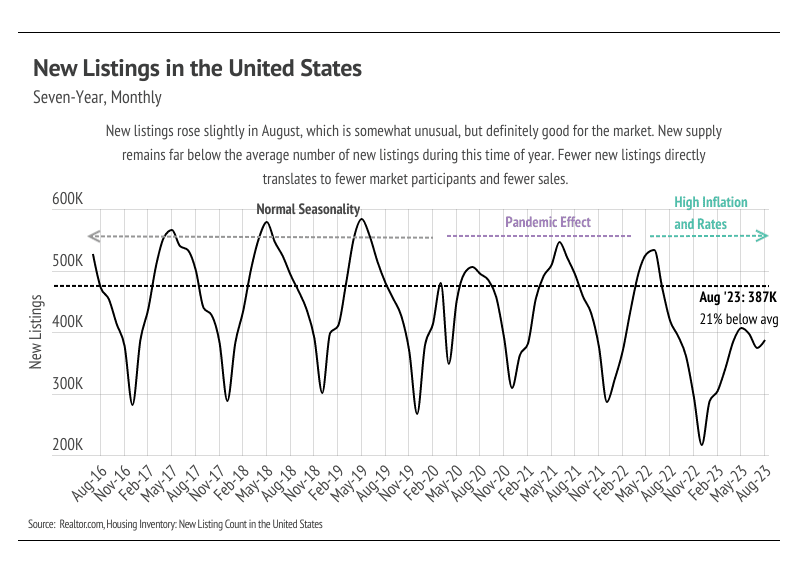
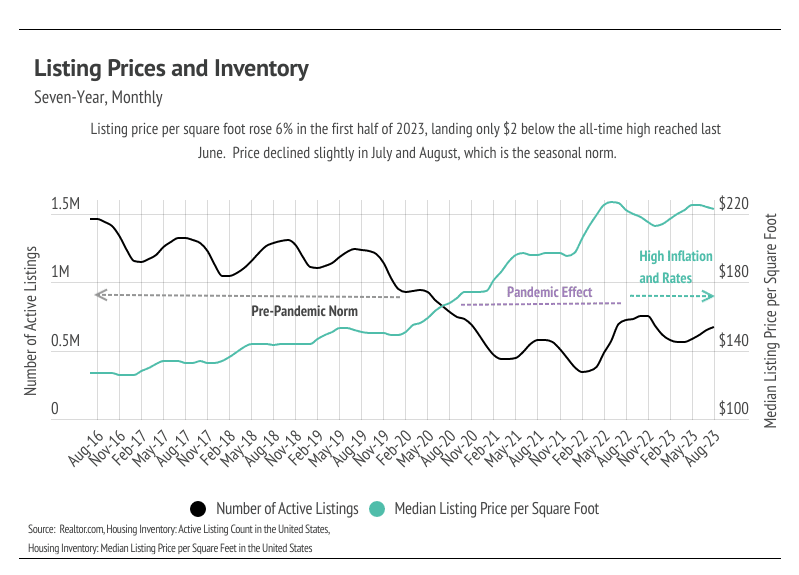
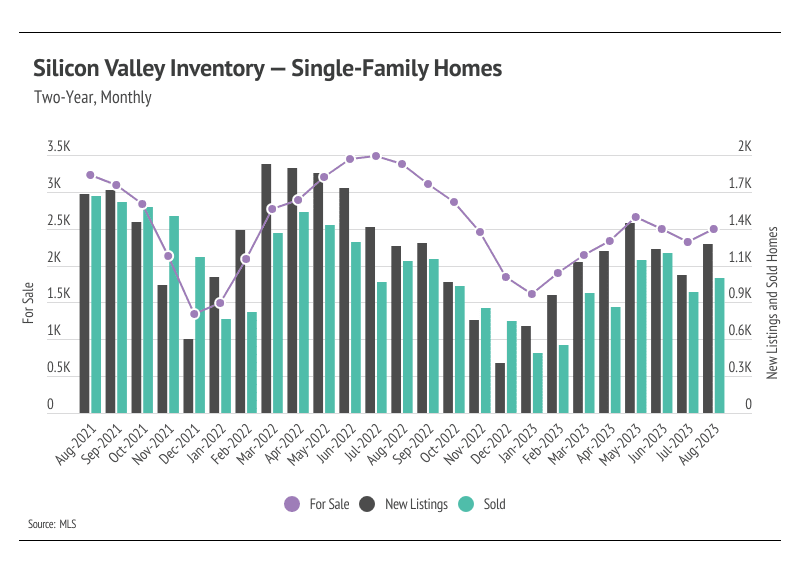
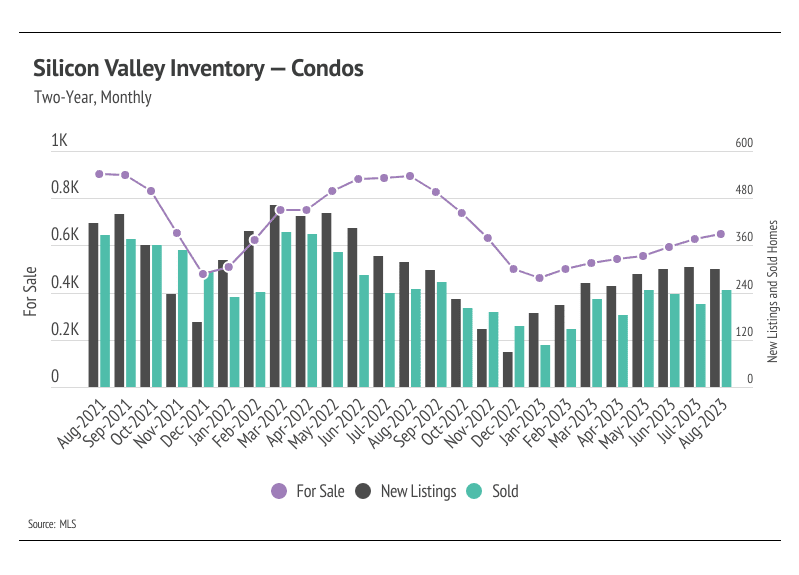
Single-family home and condo inventory, sales, and new listings trended higher year to date, although all remain at significantly depressed levels. Typically, inventory peaks in July or August and declines through December or January. Single-family home and condo inventory reached new highs for the year in August, but we will likely see fewer transactions in the coming months if normal seasonal trends hold. Currently, inventory is so low relative to demand that any amount of new listings is good for the market. However, new listings were unusually low this year, which has directly impacted both inventory and sales. The number of home sales is, in part, a function of the number of active listings and new listings coming to market.
-
Inventory Growth: An increase in inventory means there are more homes available for buyers to choose from. This can lead to a more balanced market and alleviate some of the competition among buyers.
-
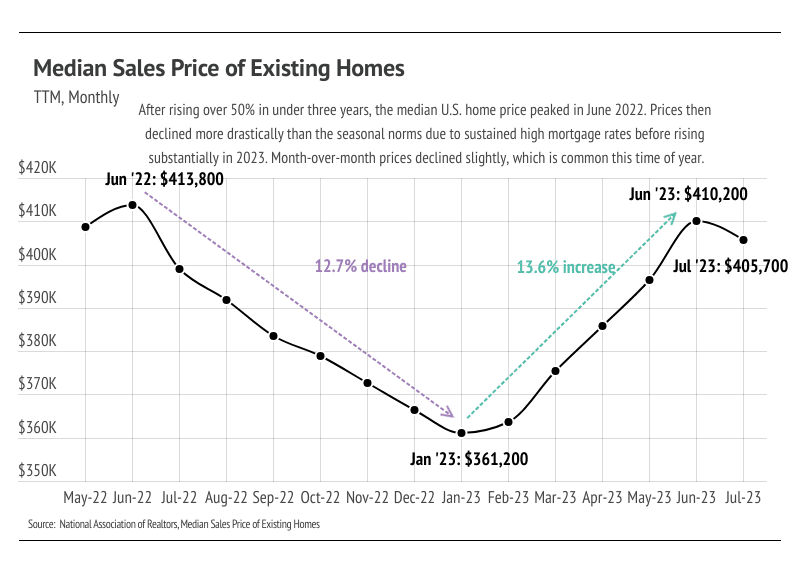
Sales Increase: Rising sales indicate continued activity in the market. It suggests that there is demand from buyers, which is essential for a healthy real estate market.
-
New Listings: More new listings mean that sellers are putting their homes on the market. This can contribute to a more dynamic market with a variety of housing options.
Big Story Data
The Local Lowdown
-
Active listings in the North Bay and Silicon Valley continued to rise in April for single-family homes, showing signs that inventory will follow normal seasonal trends, albeit at depressed levels. Inventory in the East Bay and San Francisco failed to grow substantially this year.
-
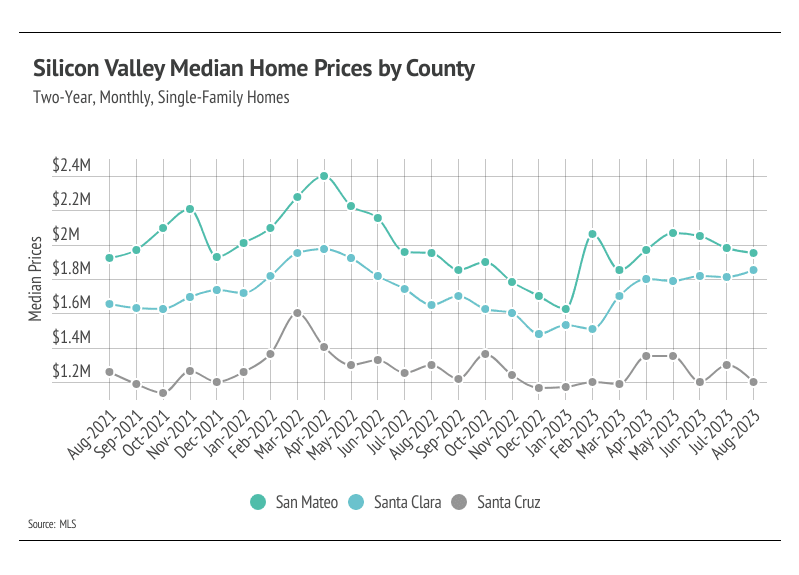
Home prices were up year to date through April 2023 across the Bay Area regions, showing that inventory and new listings can drive prices higher whether more or fewer are coming to market.
-
Months of Supply Inventory has declined significantly in 2023, and sellers are receiving a greater percentage of asking price, both of which highlight an increasingly competitive environment for buyers.
Note: You can find the charts/graphs for the Local Lowdown at the end of this section.
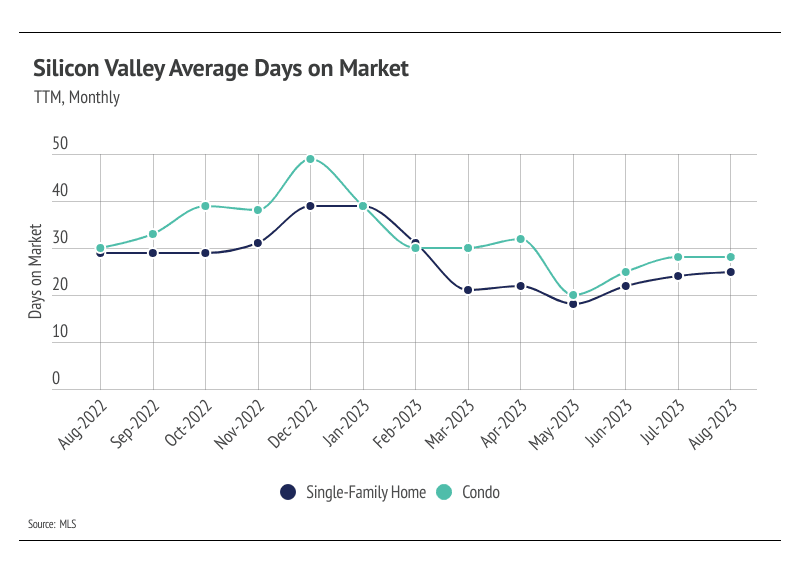
Months of Supply Inventory remained under two months in August, indicating a strong sellers’ market
Months of Supply Inventory (MSI) quantifies the supply/demand relationship by measuring how many months it would take for all current homes listed on the market to sell at the current rate of sales. The long-term average MSI is around three months in California, which indicates a balanced market. An MSI lower than three indicates that there are more buyers than sellers on the market (meaning it’s a sellers’ market), while a higher MSI indicates there are more sellers than buyers (meaning it’s a buyers’ market). The Silicon Valley market tends to favor sellers, especially for single-family homes, which is reflected in its low MSI. MSI has trended horizontally over the past six months at a low level.
Local Lowdown Data
CLINK LINKS and FOLLOW US for more updates!